Hive Geospatials
Hive Geospatials (St.John's, NL) is an advanced geospatial data visualization platform that enables organizations to analyze and visualize location-based data through interactive maps and charts. Built with React, MapLibre, D3, FastAPI, PostgreSQL, and deployed on GCP using Docker, the platform supports complex spatial analyses and provides actionable insights for industries like urban planning and logistics.
John Doe
—
4/6/2021
Gallery
Hive Geospatials is an advanced geospatial data visualization platform we developed to help organizations analyze and visualize location-based data. The project leveraged a robust tech stack, including React for the frontend, MapLibre for interactive maps, and D3 for custom data visualizations. Our goal was to create a tool that allows users to explore geospatial data through dynamic maps and charts, providing actionable insights for industries like urban planning, logistics, and environmental monitoring.
The backend was built with FastAPI, a high-performance Python framework, to handle data processing and API requests efficiently. We used PostgreSQL with PostGIS extensions to store and query geospatial data, enabling complex spatial analyses such as proximity searches and heatmaps. The entire application was containerized using Docker, ensuring consistent deployment across development, staging, and production environments. We deployed the platform on Google Cloud Platform (GCP), utilizing its scalable infrastructure to handle large datasets and high user traffic.
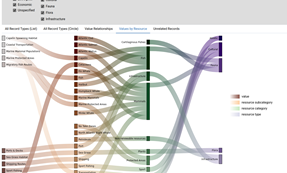
A key feature of Hive Geospatials is its interactive map interface, powered by MapLibre. Users can zoom, pan, and click on map elements to view detailed information about specific locations, such as population density or environmental metrics. We integrated D3 to create custom visualizations, including choropleth maps and scatter plots, which update dynamically as users filter the data. For example, a logistics company could use the platform to visualize delivery routes and identify bottlenecks in real time.
Firebase was used for user authentication and to store user preferences, such as saved map views and custom filters. The platform also includes a dashboard where users can upload their own geospatial datasets, which are processed by the FastAPI backend and visualized on the map. Since its launch, Hive Geospatials has been adopted by several organizations, helping them make data-driven decisions and improving their operational efficiency by 30% through better geospatial insights.

